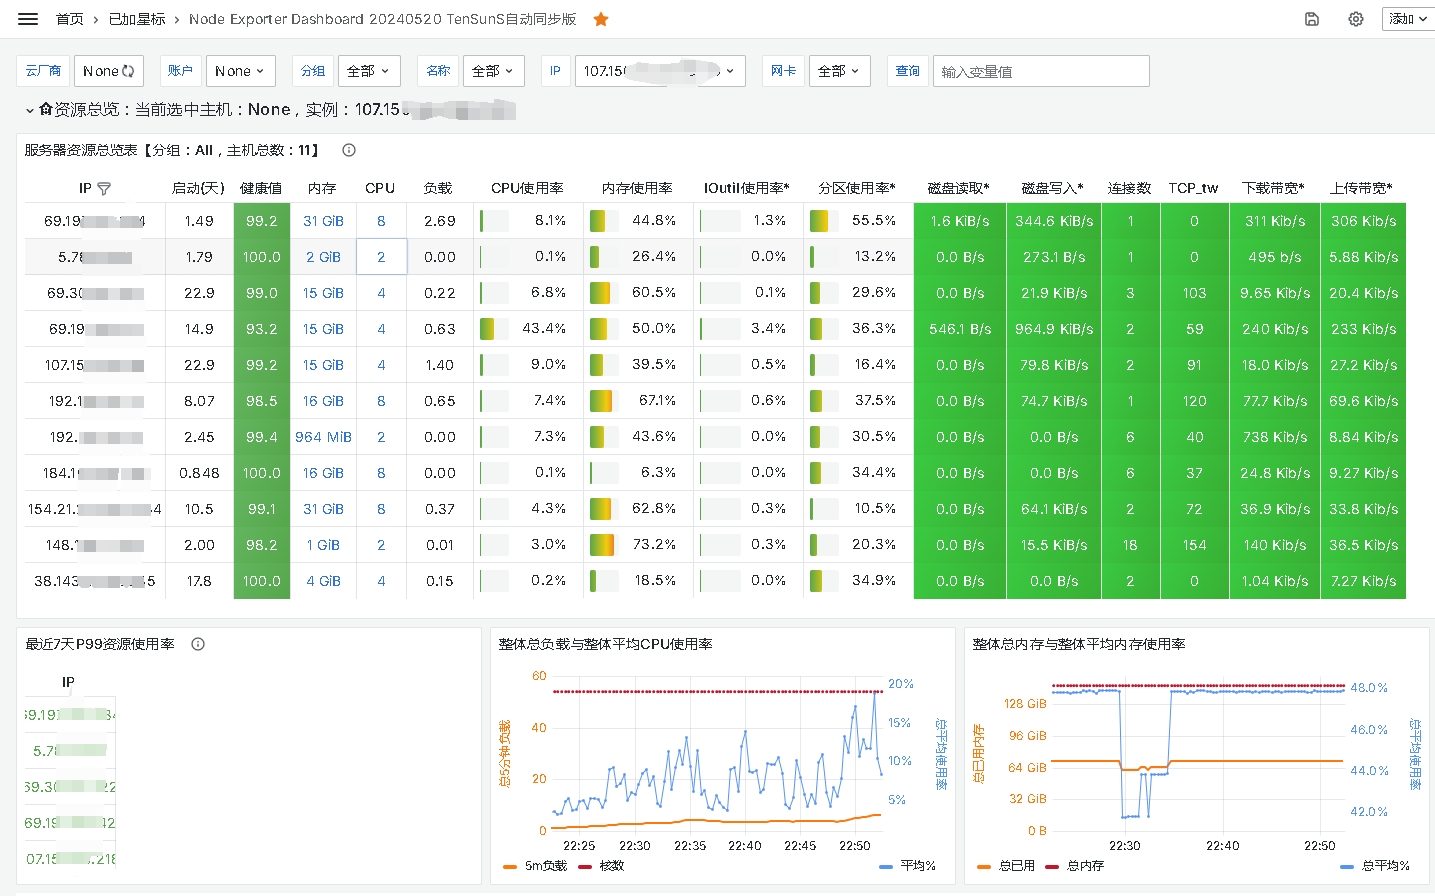
大号探针效果图
搭建过程
主服务器安装Prometheus+Grafana
操作系统:debian12
安装Prometheus
Prometheus 项目主页:https://github.com/prometheus/prometheus/
根据自己的操作系统选择合适的包
apt-get update && apt-get dist-upgrade -y

apt install screen unzip wget curl net-tools git ntpdate -y
下载prometheus安装包:
wget https://github.com/prometheus/prometheus/releases/download/v2.53.1/prometheus-2.53.1.linux-amd64.tar.gz

tar zxf prometheus-2.53.1.linux-amd64.tar.gz -C /opt

mv /opt/prometheus-2.53.1.linux-amd64 /opt/prometheus

wget -P /lib/systemd/system http://d.junlin.li/prometheus/prometheus.service
启动prometheus服务并设置开机启动
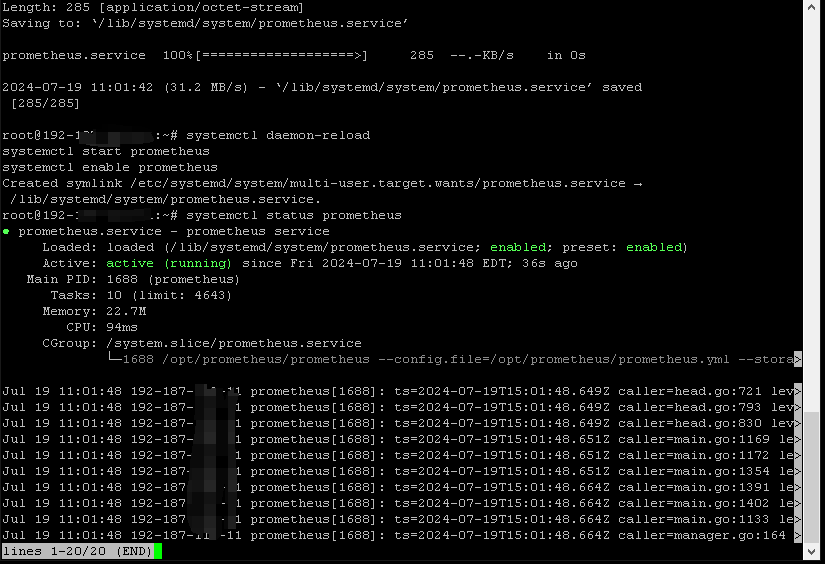
systemctl daemon-reload

systemctl start prometheus

systemctl enable prometheus
查看prometheus运行状态
systemctl status prometheus
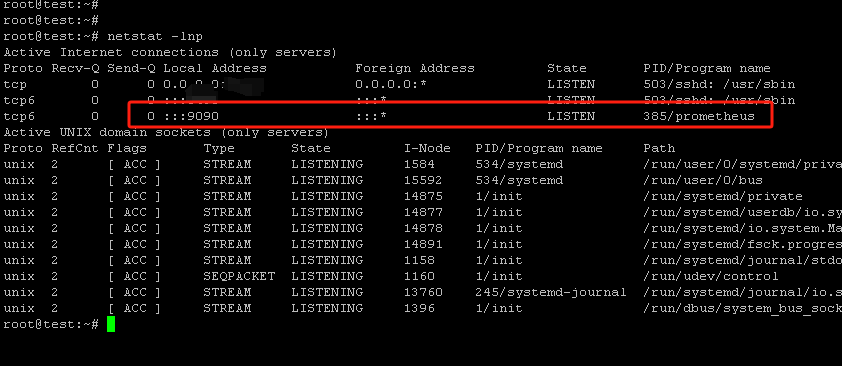
查看 prometheus 9090端口是否起来
netstat -lnp
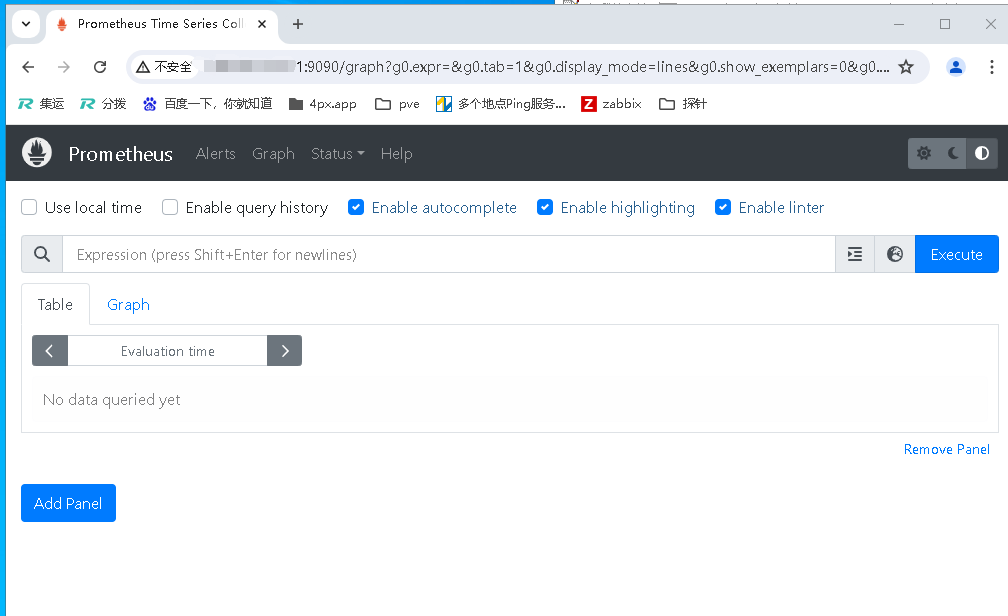
浏览器里访问 http://ip:9090 查看是否正常
安装Grafana
apt install apt-transport-https software-properties-common -y
设置官方源
wget -q -O - https://packages.grafana.com/gpg.key | apt-key add -
下面这个是一条命令,需要两行一起复制。
echo "deb https://packages.grafana.com/oss/deb stable main" | tee /etc/apt/sources.list.d/grafana.list
安装Grafana
apt update -y && apt install grafana -y
启动 grafana 服务并设置开机启动
systemctl daemon-reload
systemctl start grafana-server
systemctl enable grafana-server
用 netstat -lnp 命令查看 grafana 3000 端口有没有起来
浏览器里访问 http://ip:3000
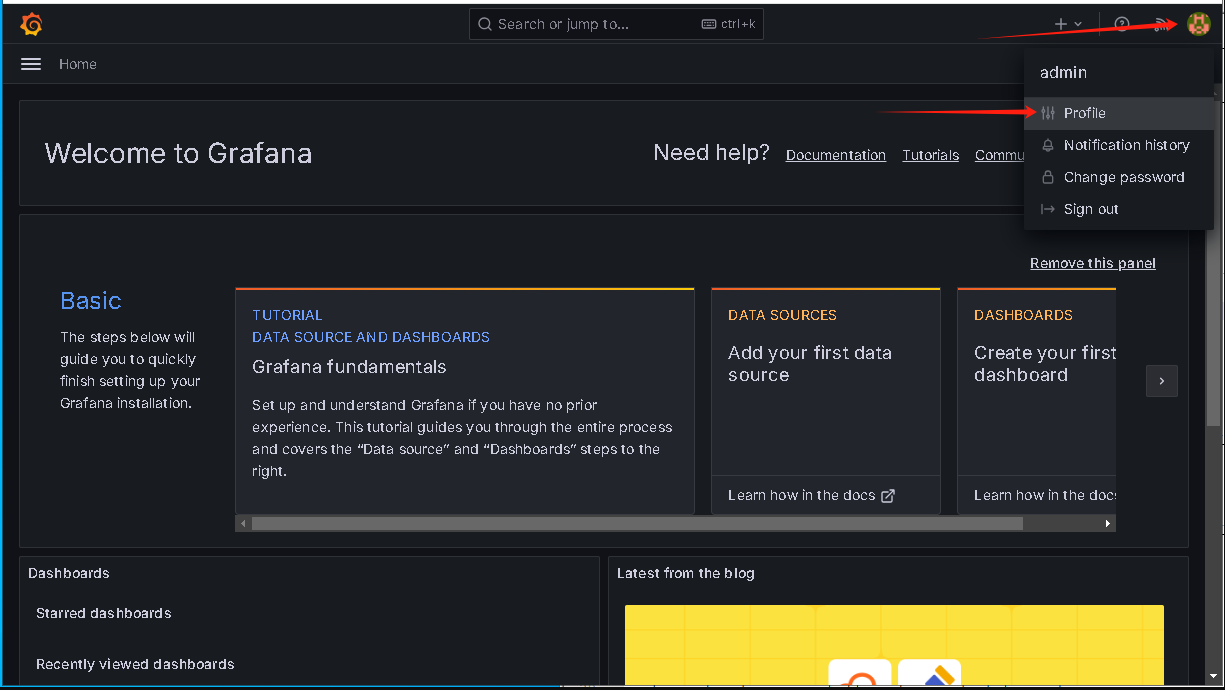
账号密码都是 admin , 登录后点 skip 跳过首次登录更改密码提示
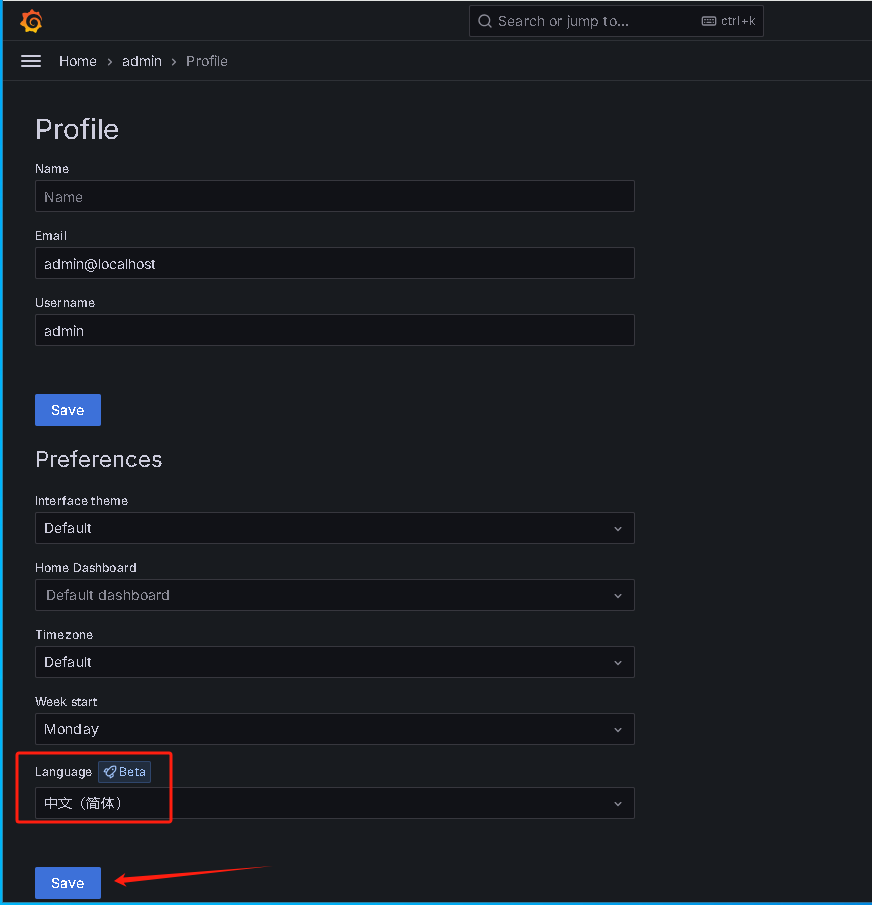
点击右上角的头像图标设置成中文,点 保存
安装配置 node_exporter
这是被监控端需要安装的,因为主服务器本身也要监控,所以也要安装
项目主页:https://github.com/prometheus/node_exporter
wget https://github.com/prometheus/node_exporter/releases/download/v1.8.2/node_exporter-1.8.2.linux-amd64.tar.gz
tar zxf node_exporter-1.8.2.linux-amd64.tar.gz -C /opt/
mv /opt/node_exporter-1.8.2.linux-amd64/ /opt/node_exporter
wget -P /lib/systemd/system http://d.junlin.li/prometheus/node_exporter.service
启动 node_exporter 并设置开机启动
systemctl daemon-reload
systemctl start node_exporter
systemctl enable node_exporter
安装 node_exporter 几个插件
grafana-cli plugins install grafana-piechart-panel
grafana-cli plugins install digiapulssi-breadcrumb-panel
grafana-cli plugins install grafana-polystat-panel
重启 node_exporter 服务
systemctl restart grafana-server
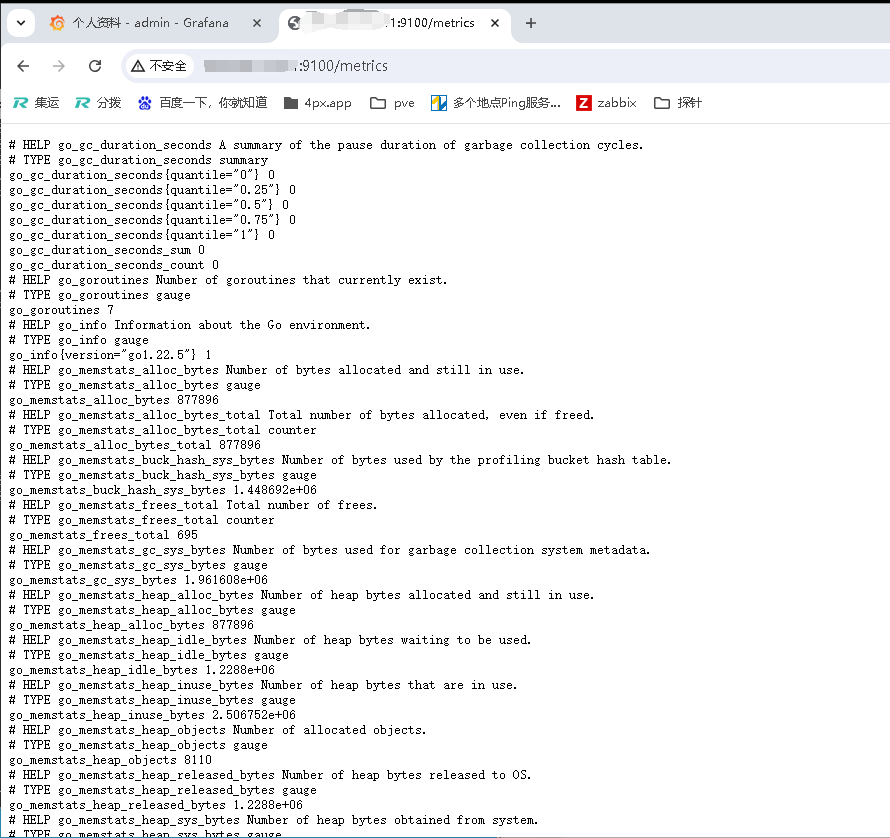
浏览器里访问 http://ip:9100/metrics 测试 node_exporter 是否获取到节点的监控指标。
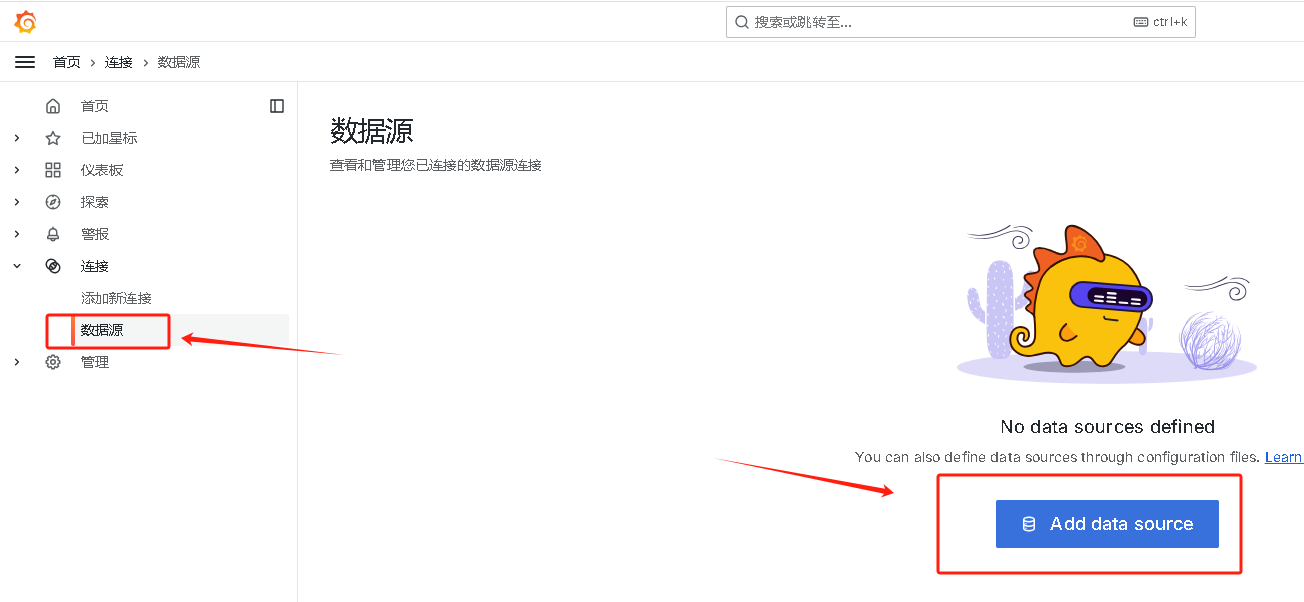
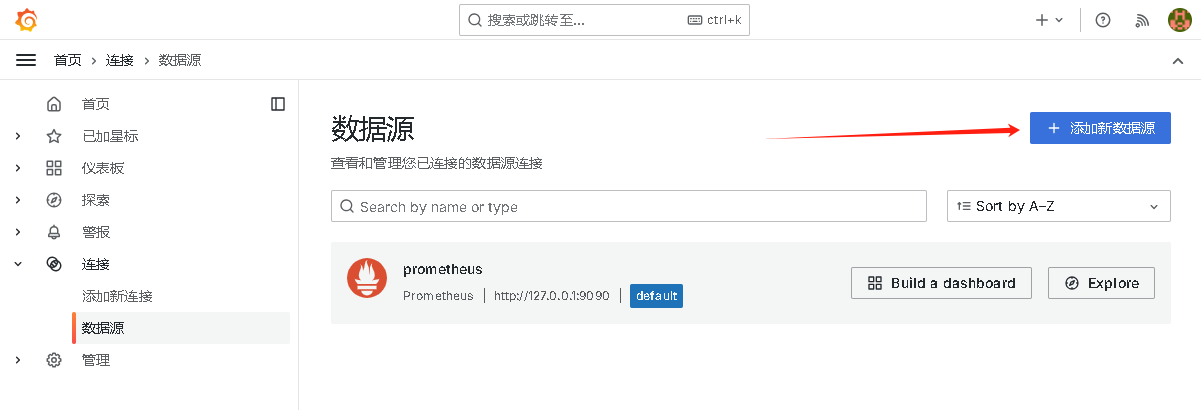
回到Grafana的主界面,添加 prometheus 主服务器数据源
点第一个 prometheus ,Connection 填写 http://127.0.0.1:9090 然后网页最下面点 Save&test
然后点 Dashboards ,选择 Prometheus 2.0 Stats 点 Import
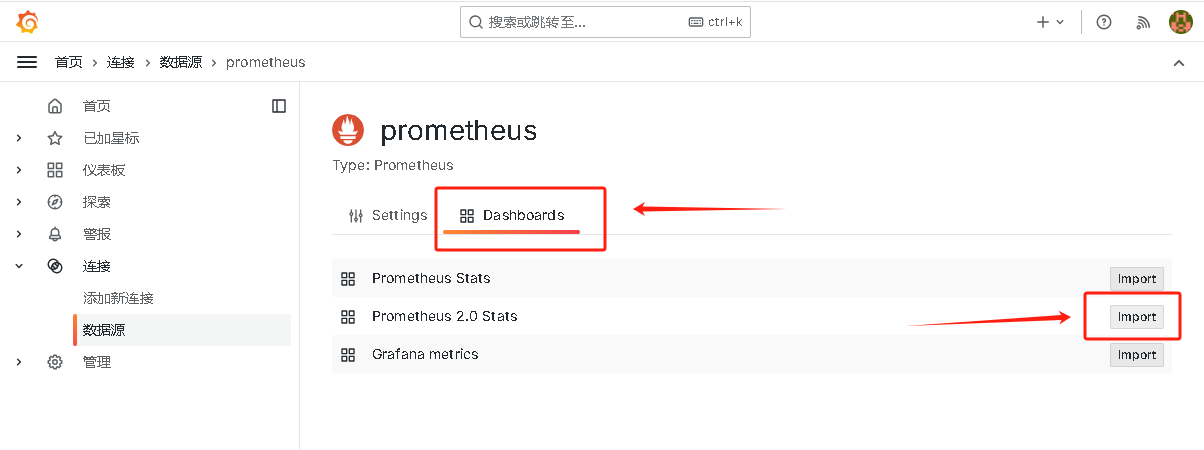
这一步必须要做,要不然后面的导入第三方仪表盘文件会没有监控数据。
导入在 https://github.com/starsliao/Prometheus/tree/master/node_exporter 这里下载的仪表盘,上传仪表板 JSON 文件
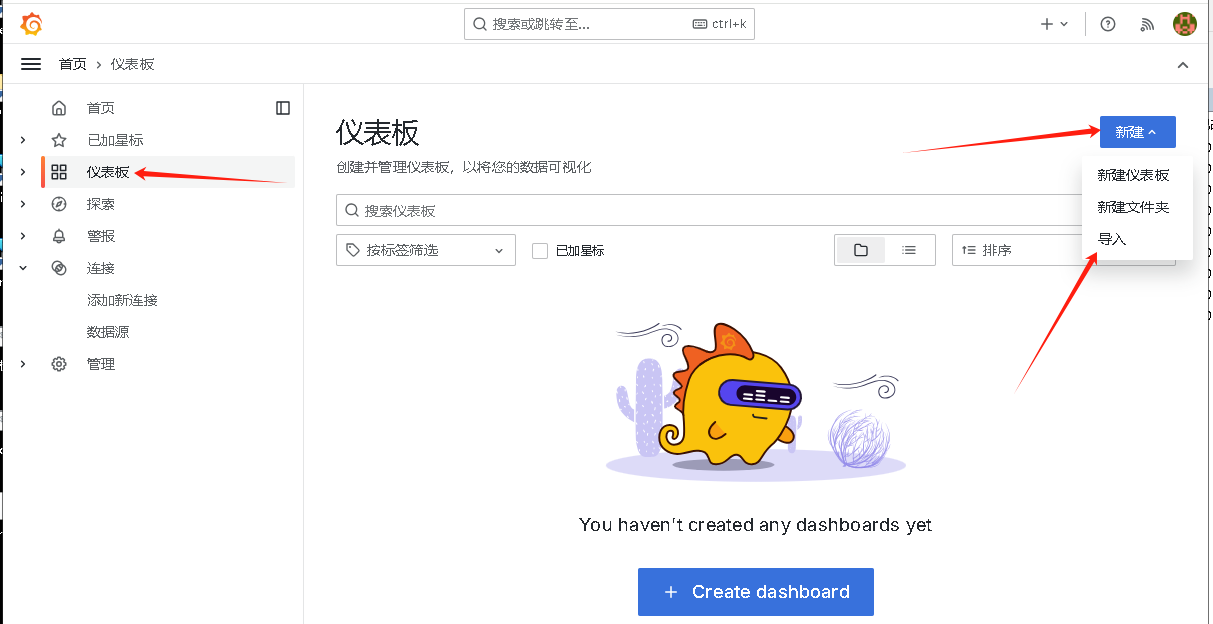
选择默认数据源,点 Import
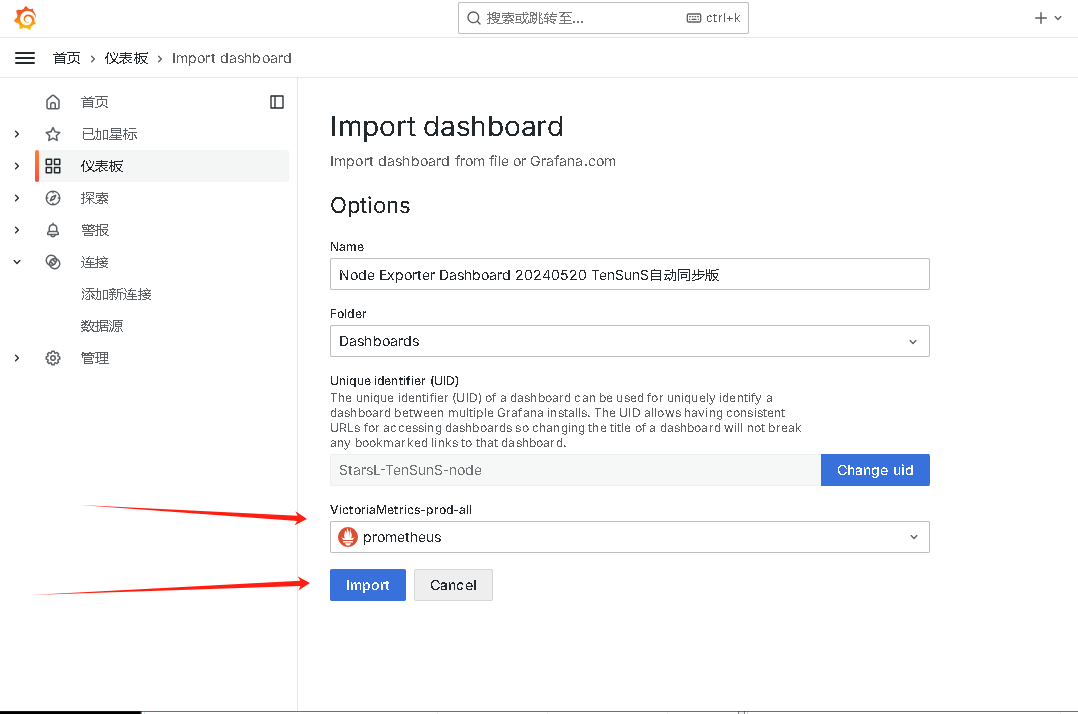
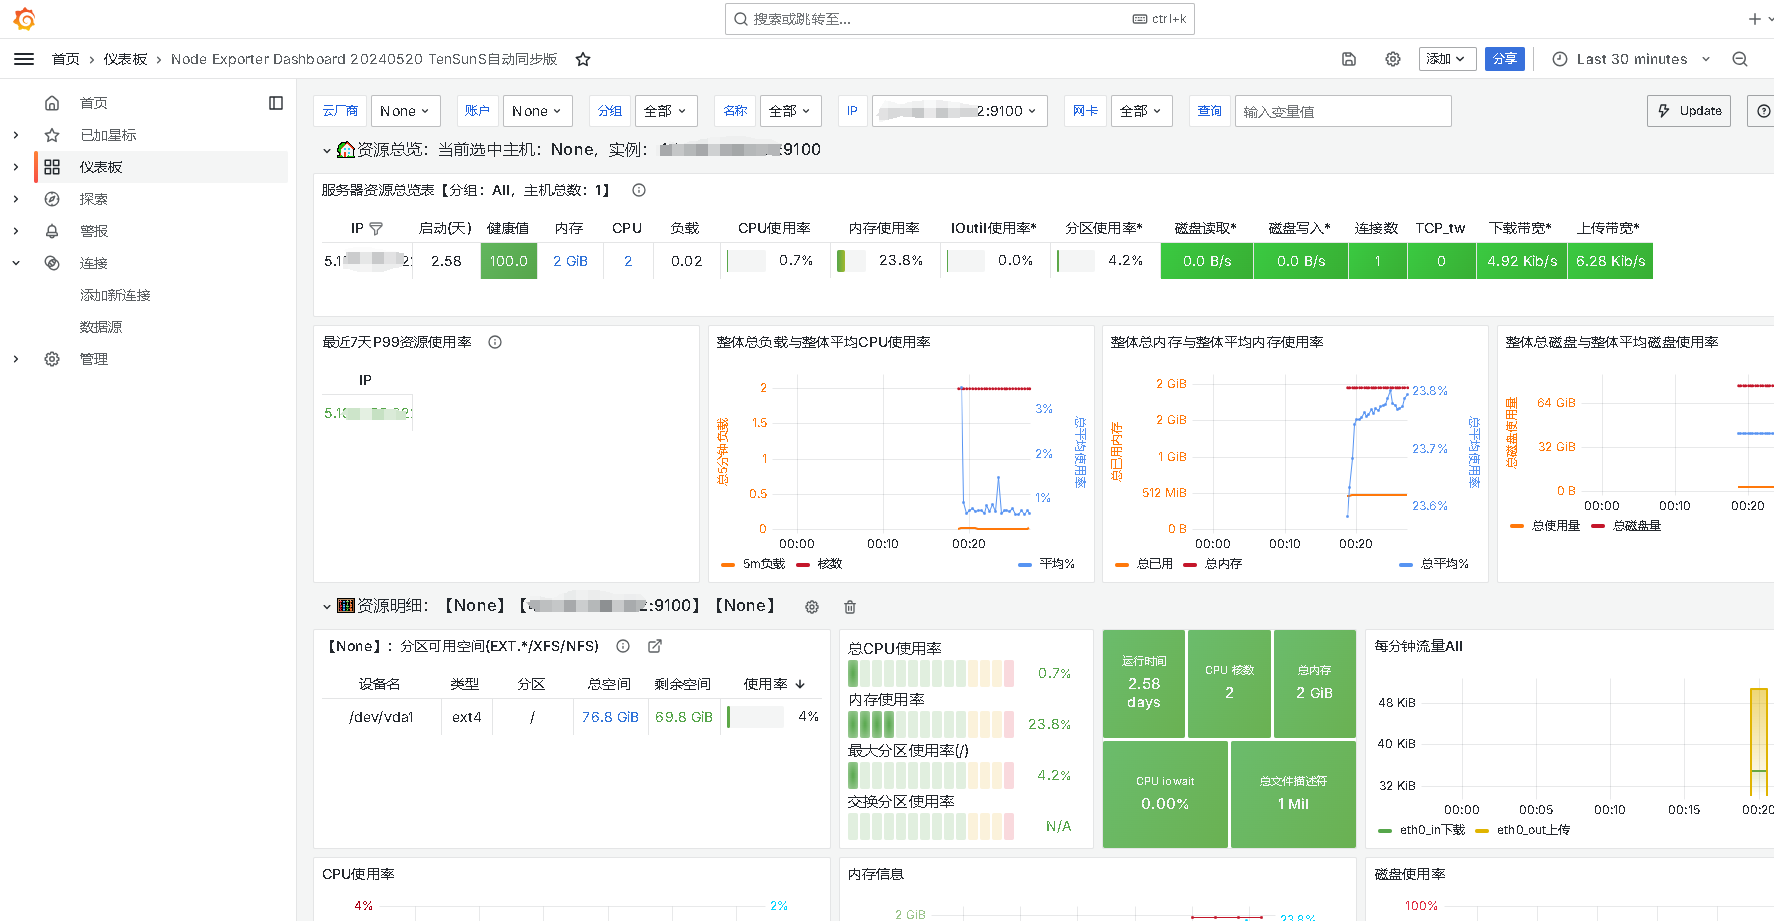
返回 仪表板,查看数据,这个仪表板 Node Exporter Dashboard 20240520 TenSunS自动同步版 ,默认是不监控127.0.0.1的数据,下面我们来添加被监控的 vps 。
在被监控的vps上面安装 node_exporter
wget https://github.com/prometheus/node_exporter/releases/download/v1.8.2/node_exporter-1.8.2.linux-amd64.tar.gz
tar zxf node_exporter-1.8.2.linux-amd64.tar.gz -C /opt/
mv /opt/node_exporter-1.8.2.linux-amd64/ /opt/node_exporter
wget -P /lib/systemd/system http://d.junlin.li/prometheus/node_exporter.service
systemctl daemon-reload
systemctl start node_exporter
systemctl enable node_exporter
安装完 node_exporter ,记得在被监控的小鸡上面检查 9100 端口有没有起来。
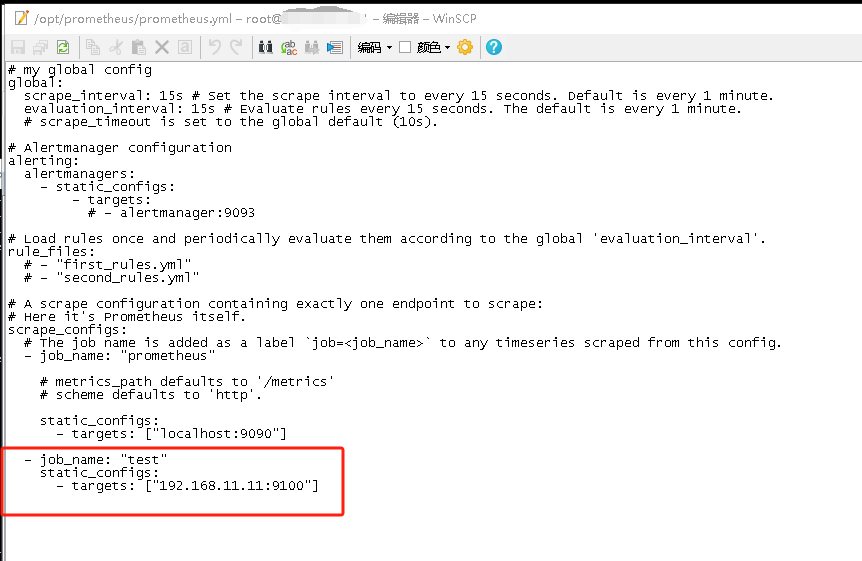
Prometheus配置文件添加被监控小鸡监控项:
用你喜欢的工具编辑文件 /opt/prometheus/prometheus.yml
务必注意格式,多少个空格就是多少个空格,不然会报错。
job_name 不能重复,一个小鸡一个名字。targets 填写被监控的小鸡 IP。
  - job_name: "test"
    static_configs:
      - targets: ["192.168.11.11:9100"]
最好是复制自带的9090模板,然后再自己改动一下。
重启 prometheus 服务。每次添加小鸡编辑后都要重启 prometheus 服务。
systemctl restart prometheus.service
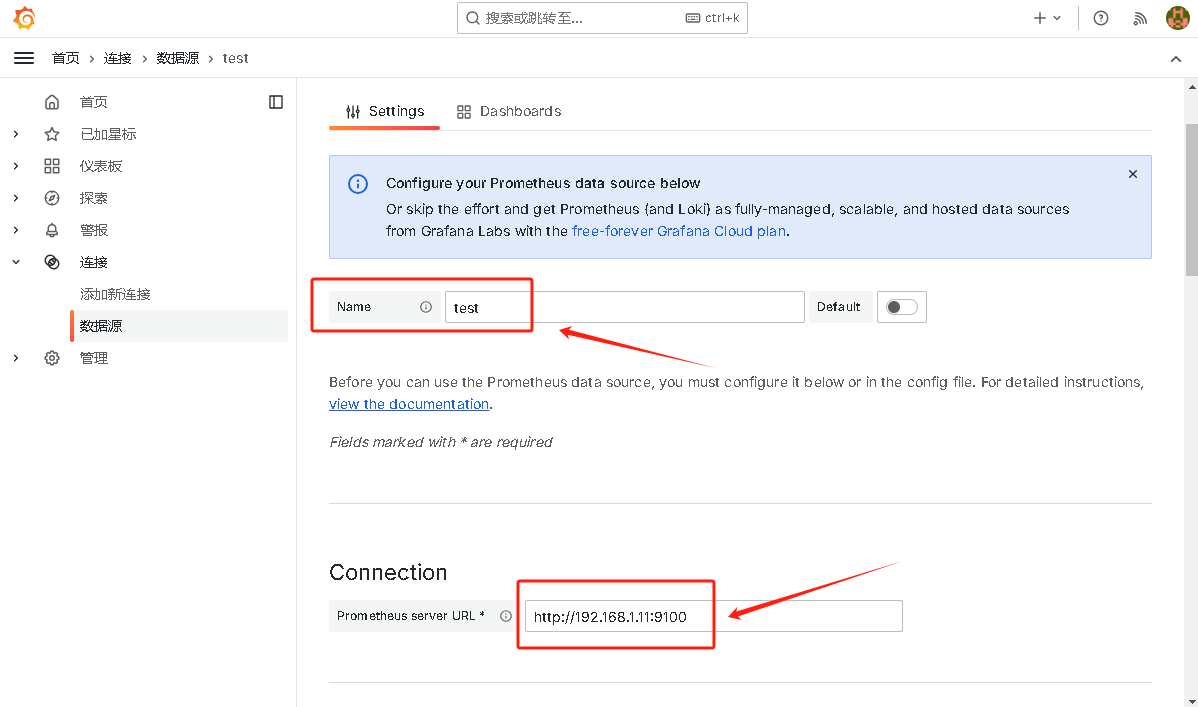
在grafana面板添加被监控小鸡数据源
名字自己取,Connection 填写被监控的小鸡 IP,然后网页最下面点 Save&test
返回仪表板,点 Node Exporter Dashboard 20240520 TenSunS自动同步版 就可以查看被监控小鸡的数据了。
如需要再添加其他小鸡的监控,重复上面的安装 node_exporter 步骤,主服务器添加prometheus配置文件,添加小鸡数据源即可。
仪表板的数据展示框框是可以自由拖动改变大小的,更改后记得点保存。
— End —